4.1
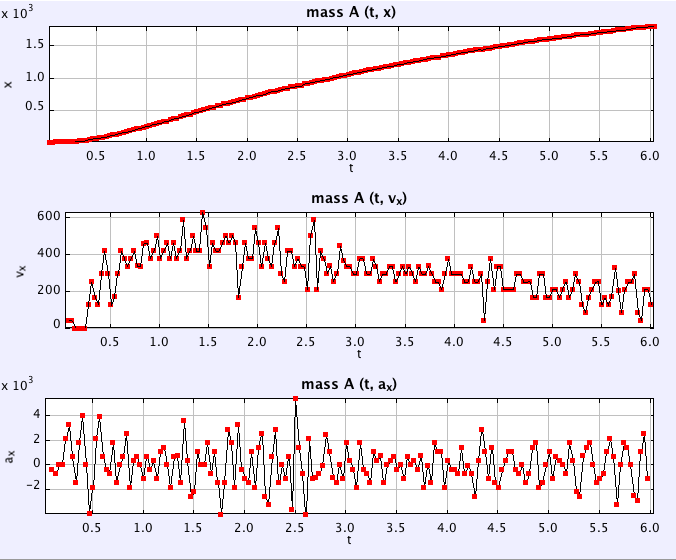
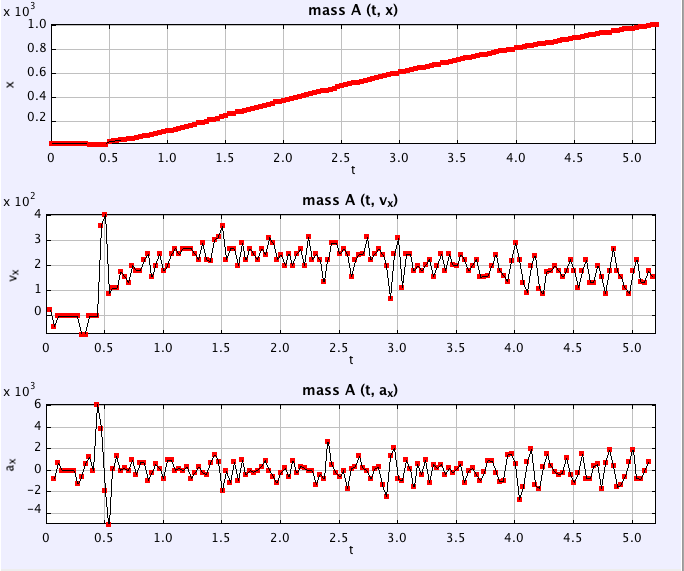

The graphs for the displacement time graph show a high upward gradient for a while before the gradient of the graph gradually decreases.
The graphs for the velocity time graph increases until around 1.5s where the car starts to slow down and the graph starts to gradually decrease
The graphs for acceleration have small spikes upward before 1.5s and small spikes downwards after 1.5s. However, the acceleration of the graphs generally deviate around 0.
These graphs show how the car accelerates before 1.5s. This is the duration of the car’s powerstroke. After the car’s powerstroke, the car decelerates to a stop due to friction and air resistance.
4.2 Data Analysis
1. Which wheels are your drive wheels? (front or back)
Back wheels
2. What is the circumference of your drive wheels?
31.4 cm
3. How far will your car travel in one rotation of the drive wheels?
31.4cm
4. How many rotations (on average ) were there in each run?
30 (Rounded off to nearest whole number)
5. How much string is used in one rotation of the drive wheels? Show how you calculated this.
2.51cm(3s.f). When the axis makes a complete round, the drive wheels make a complete round too. As the circumference for the axis is 2.51cm, the length of string needed in one rotation is 2.51cm
6. The release of the lever is the power stroke. What is the length of your vehicles power stroke? (Length of string released)
(axis 0.4) 15.9cm
7. Calculate how far your vehicle will travel during the power stroke. Show your calculations!!
(Length/axis circumference)xdrive wheel circumference
=(15.9/2.51)x31.4
=199cm(3s.f.)
=1.99m
8. Compare the answer to #7 to the distance your measured during your car’s power stroke. Discuss possible reasons for different valuables.
The car’s inertia causes the car to continue moving forward. However, the friction and the air resistance eventually slows the car down.
As there is no more thrust force acting on the car, the only force acting on it will be frictional force which causes the car to decelerate to a stop.
9. Calculate the average velocity for your car during the period after the spring fully releases.
Total distance travelled - Distance travelled in powerstroke
=9.33-1.99
=7.34m(3s.f)
Average velocity
=Distance/time
=7.34/7.63
=0.962m/s(3s.f)
10. What force causes your car to stop?
Frictional Force, Air resistance
11. The work done by a force is calculated by multiplying the force times the distance over which it acts. The work done on an object is equal to the change in its kinetic energy. Can you find a way to calculate the force of friction? Use equations and explain your steps. HINT: Be careful, you have calculated average velocity. How can you find the total amount of kinetic energy (immediately after spring release) if we assume the acceleration during coasting was constant?
Thrust is constant.
Since car is travelling at constant velocity, friction is constant because the car is travelling
at constant velocity.
work done(by friction)
= Net Force x Distance
= 0 x 7.34
=0
KE
= ½ x mass x velocity^2
=½ x 0.185kg x0.962m/s
= 0.08560357J
12. Various experiments have been done to measure the potential energy available from the spring. One estimate is 0.65 Joules. Using your estimates of the maximum kinetic energy of your car and the work done by friction, discuss whether or not this is a reasonable value. Can you account for any differences in the forms of energy? You must justify all of your arguments.
Work Done(EPE) = Elastic potential energy
Potential Energy = KE-WorkDone(by friction)
Since Friction=0,
PE=KE
Assuming PE=KE, this is not a reasonable value. Other forms of energy may include sound and heat energy.
No comments:
Post a Comment